 |  |

The Apache::Status module allows you to peek inside the Perl interpreter in the Apache web server. You can watch the status of the Perl interpreter: what modules and Registry scripts are compiled in, the content of variables, the sizes of the subroutines, and more.
To configure this module you should add the following section to your httpd.conf file:
<Location /perl-status>
    SetHandler perl-script
    PerlHandler +Apache::Status
</Location>
and restart Apache.
Now when you access the location http://localhost:8000/perl-status you will see a menu (shown in Figure 9-1) that leads you into various sections that will allow you to explore the innards of the Perl interpreter.
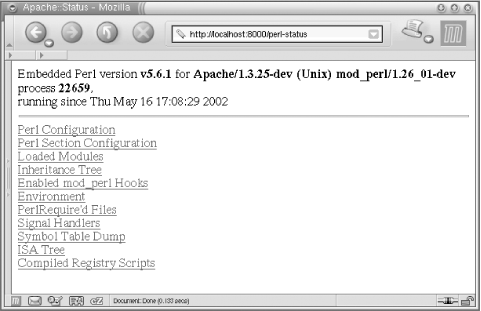
When you use this module for debugging, it's best to run the web server in single-server mode (httpd -X). If you don't you can get confused, because various child processes might show different information. It's simpler to work with a single process.
To enable the Apache::Status modules to present more exotic information, make sure that the following modules are installed: Data::Dumper, Apache::Peek, Devel::Peek, B::LexInfo, B::Deparse, B::Terse, and B::TerseSize. Some of these modules are bundled with Perl; others should be installed by hand.
When you have the aforementioned modules installed, add these directives to your httpd.conf file:
PerlSetVar StatusOptionsAll On
PerlSetVar StatusDumper On
PerlSetVar StatusPeek On
PerlSetVar StatusLexInfo On
PerlSetVar StatusDeparse On
PerlSetVar StatusDeparseOptions "-p -sC"
PerlSetVar StatusTerse On
PerlSetVar StatusTerseSize On
PerlSetVar StatusTerseSizeMainSummary On
and restart Apache. Alternatively, if you enable all the options, you can use the option StatusOptionsAll to replace all the options that can be On or Off, so you end up with just these two lines:
PerlSetVar StatusOptionsAll On
PerlSetVar StatusDeparseOptions "-p -sC"
When you explore the contents of the compiled Perl module or Registry script, at the bottom of the screen you will see a Memory Usage link. When you click on it, you will be presented with a list of funtions in the package. For each function, the size and the number of OP codes will be shown.
For example, let's create a module that prints the contents of the %ENV hash. This module is shown in Example 9-6.
package Book::DumpEnv;
use strict;
use Apache::Constants qw(:common);
sub handler {
    shift->send_http_header('text/plain');
    print map {"$_ => $ENV{$_}\n"} keys %ENV;
    return OK;
}
1;
Now add the following to httpd.conf:
<Location /dumpenv>
    SetHandler perl-script
    PerlHandler +Book::DumpEnv
</Location>
Restart the server in single-server mode (httpd -X), request the URL http://localhost:8000/dumpenv, and you will see that the contents of %ENV are displayed.
Now it's time to peek inside the Book::DumpEnv package inside the Perl interpreter. Issue the request to http://localhost:8000/perl-status, click on the "Loaded Modules" menu item, and locate Book::DumpEnv on the displayed page. Click on it to request a page at the URI http://localhost:8000/perl-status?Book::DumpEnv. You will see the screen shown in Figure 9-2.
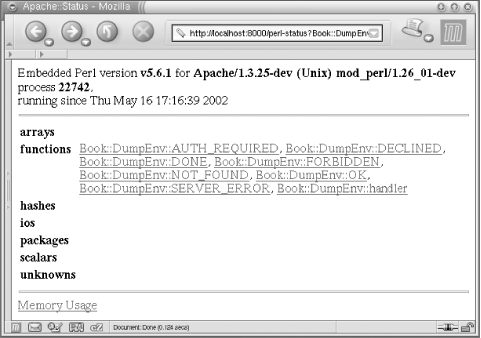
You can see seven functions that were imported with:
use Apache::Constants qw(:common);
and a single function that we have created, called handler. No other Perl variable types were created in the package Book::DumpEnv.
Now click on the "Memory Usage" link at the bottom of the page. The screen shown in Figure 9-3 will be rendered.
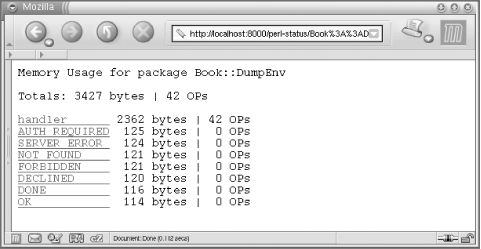
So you can see that Book::DumpEnv takes 3,427 bytes in memory, whereas the handler function takes 2,362 bytes.
Is this all? No, we can go even further inside the code and learn the syntax tree size (i.e., what opcodes construct each line of the source code and how many bytes each source-code line consumes). If we click on handler we will see the syntax tree of this function, and how much memory each Perl OPcode and line of code take. For example, in Figure 9-4 we can see that line 7, which corresponds to this source-code line in Book/DumpEnv.pm:
7: return OK;
takes up 136 bytes of memory.
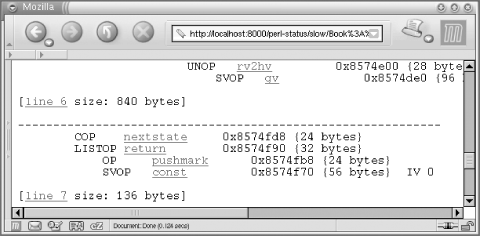
We found the corresponding source-code line by clicking the "line 7" hyperlink shown in Figure 9-4, which displays the source code of the module with the relevant line highlighted (see Figure 9-5).
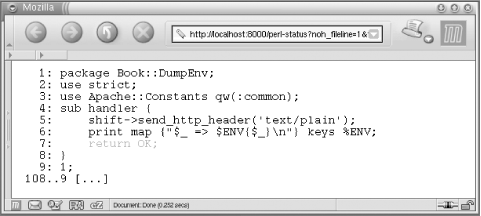
Now you should be able to to find out how much memory each subroutine or even each individual source line of Perl code consumes. This will allow you to optimize memory usage by comparing several implemenations of the same algorithm and choosing the one that consumes the smallest amount of memory.

Copyright © 2003 O'Reilly & Associates. All rights reserved.